圓底(Rounding Bottom)又稱為碟形(saucers)或碗形(bowls),是一種逆轉形態,但並不常見。此類形態大多數出現在一個由熊市轉為牛市的長時間整固期。但在我們的例子中,是以短時間的整固期為例。 圓底常常在一個長期跌市後出現,低位通常記錄新低及回跌。圓底形態可分為三部份: 下降、最低及上升。 形態的第一部份是下降:即帶領圓形到低位。下降的傾斜度不會太過份。第二部份是圓孤底的最低位,與尖底很相似,但不會太尖。這部份通常出現時間較長或升幅可達一個月。最後是上升部份,通常是圖形的後 及大約與下降所的時間相同。如上升部份升得太快,便會破壞了整個形態,而且變為假訊號。 整個圖形來看,如價格還未穿破阻力位,即圖形開始的下降位置;圓底仍未確認。 成交量通常跟隨圓底形態: 最高位即下降的開始、最低位即下降的終點及升幅變強。 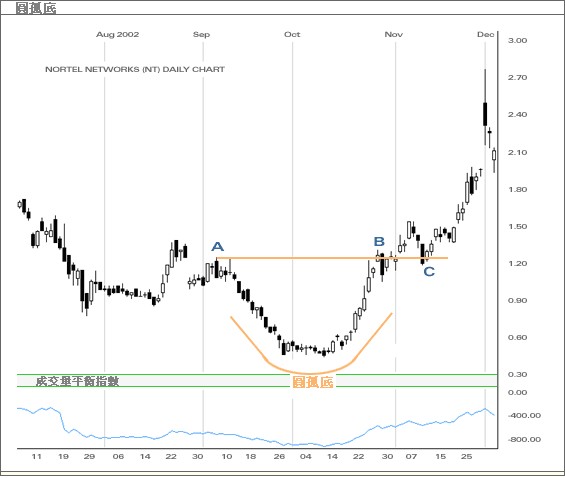
以上圖例,圓底只出現在個多月間形成,但當穿破阻力位後,價格隨即向上。價格由A點開始向下,但到B點再試轉為整固期。當價格升穿阻力位B點,先前的阻力位變為支持位C點。價格回落但受制於這個支持位,價格向上升。成交量平衡指數也同時確認圓底圖形,主要因為OBV很明確的跟隨下降/整固/上升的圖形,以及上升非常強勁。 |