�X�Ϊ����A�N���@�����b�X�쳻�W���X�m�A�q�`�b��t�ӤS�j�T�������i�ʤ��X�{�C�ѻ��g�L�@�s���K���u���i�ʫ�A�Φ��@�ӵy�L�P����Ͷէe�ۤϤ�V�ɱת�����ΡA�o�N�O�X�Ψ��աC�X�Ψ��դ����W�ɺX�ΩM�U���X�ΡC ���ѻ��g�L�~�k���t�ɫ�A���ۧΦ��@�Ӻ�K�B�U���M�y�L�V�U�ɱת�����K���ϡA��o�K���Ϫ����I�M�C�I���O�s���_�ӡA�K�i���X�G������ӤU�ɪ����u�A�o�N�O�W�ɺX�ΡC���ѻ��X�{��t�Ϋ������U�^��A���ۧΦ��@�Ӫi�ʯU���Ӻ�K�A�y�L�W�ɪ�����K���ϡA���O�@���W�ɳq�D�A�o�N�O�U���X�ΡC ���A������ѻ��K�~��V��Ӫ��Ͷղ��ʡA�W�ɺX�αN���V�W��}�A�ӤU���X�Ϋh���U�^�}�C�W�ɺX�Τj�h�Ʀb���������X�{�A�]���t�ܤɥ��i��i�J���n���q�F�ӤU���X�Ϋh�j�h�Ʀb��������X�{�A��ܤj���i��@���������U�^�A�]���Φ����X�βӤp�A�j���b�T�A�|�ӥ���餺�g�w�����A���p�G�b���������X�{�A�Φ����ɶ������A�B�^�}��u�i�@�����ת��U�^�C ���κX�O�Ѩ���ۦP��V���ʥB���K�����u�Ӧ��A�ӳo������u�O�b���u�ɶ����Φ��@�ӫ�����T���ΡC���θ��`�X�{�b�@�Ӻ��թζ^�ժ����ߦ�m�A�Y�W���������q��z�ΤU�^�L�{�����ϼu�k�R�i�A�Ӧ���q�j�h�Ʀb��z�L�{���v����֡A�Ӧb��}�ζ^�}��q��S��۪���j�C �b�W���Ͷդ��A���κX�O�ѥ��W��V�k�U��ɱ� ; �b�U���Ͷդ��A�h�ѥ��U��V�k�W��ɱסA�Ϊ��P�X�άۦ��A�ṳ������a�����X�x�C 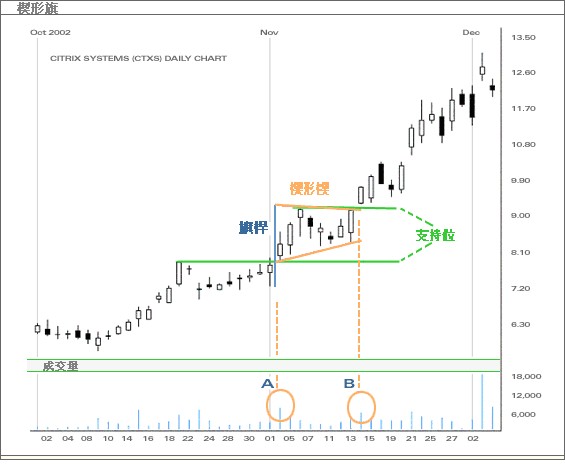
�W�Ϭ����κX���Ҥl�A�b�@�ӤW�ɪ����p�A�]A�I�X�{�j�q����A�X��b�o�اΦ��C�b�h�ӬP������T����A������զb���κX���}�l��հ�(�YB�I)�C����}���O��A�A�[�W����q�W�ɡA�ϧνT�{�ΤɶձN����C 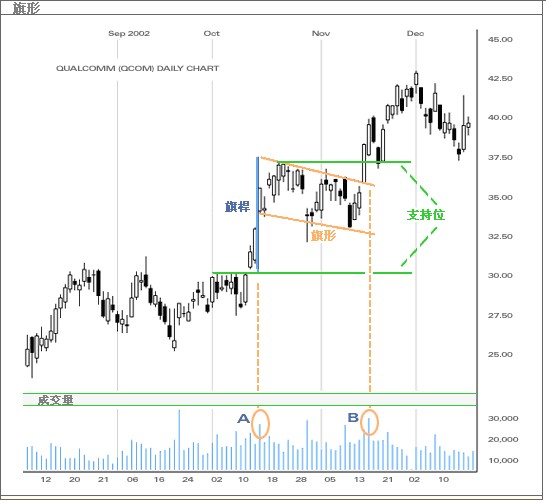
�H�W�����Ϊ��Ҥl�A�b�@�ӤW�ɪ����p�A�]A�I�X�{�j�q����A�X��b�o�اΦ��C�b�@�Ӥ몺��T����A������զb�X�Ϊ��}�l����հ�(�YB�I)�C����}���O��A�A�[�W����q�W�A�T�{�ϧΤΤɶձN �~��W�ɡC |