|
Prosticks Articles
信報 --- 十二月四日
運用移動平均線慎防假突破
移動平均線是一個既簡單又常用的技術分析工具,傳統智慧指出,當價位收市在移動平均線之上時,應該買入;相反,當價位收於移動平均線之下時,應該沽出。長線而言,這是一個很有用的策略,然而,當市場整固期間,價位往往會在平均線附近上落,這個策略反會令投資者損失得更快。
雖然如此,移動平均線對於預測支持位或阻力位仍然很有用,當價位破位上升或下跌時,通常代表新趨勢的開始。
AT&T是美國最大的電話公司,正如香港的電訊盈科(008)。比較起62美元的歷史高位,目前股價已經下跌70%(圖)。不過,圖中的四十天平均線,不是普通的移動平均線,它是用聚焦點代替收市價計算出來的(在乾坤燭網頁,允許使用者自由選擇用收市價還是用聚焦點來計算移動平均線)。
至於用多少天平均線,似乎是地區性的偏好,香港的投資者喜歡五十天,美國投資者則喜歡四十天,這方面並無理論依據支持任何一種,僅地區性的習慣不同而已。
從圖中可以看到平均線的強阻力作用,每一次股價從低位反彈,一碰到平均線就遇阻而回(圖中箭咀位置),聚焦點一次也未曾升穿過這條線。可以推斷,這條平均線的阻力作用將一直延伸下去,除非其後聚焦點能升破它,否則跌勢仍然持續。
如果拿出 AT&T的陰陽燭圖來看,我們可以發覺有些燭的高位或收市位曾經高過這條四十天平均線,形成「假突破」。為了避開走勢陷阱,跟隨平均線買賣策略的投資者,應該待聚焦點能升破平均線才行動。(有關乾坤燭之連載可於乾坤燭網站
www.prosticks.com 內觀看)
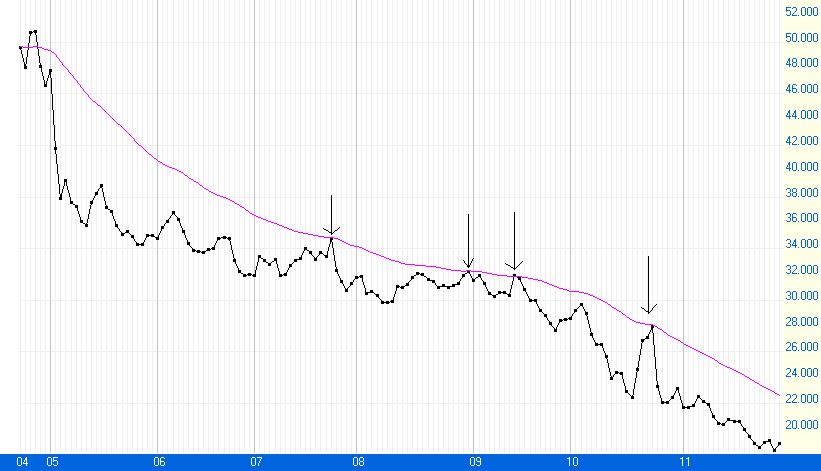
AT&T股價走勢
(2000年4月1日
- 11月1日)
|