Sep 1, 2026  11:59:05 AM HKT

TourSiteMapFAQsAboutContact
Home QR  Forex TV 
UsernamePassword
SavePW
sp

  Home > Education > Articlespatentsp
  
sp
sp
sp
articles
 

Prosticks Articles

Hong Kong Economic Journal --- 30 Oct, 2000

Modal Count Insights

The amount of time the market spends trading at each price sheds light on the interaction among the bulls and the bears. Price movement is an equation of demand and supply. Only when the buying force completely dissipates the selling force will price rise. By the same token, only when the bears completely exhaust all the available buying force will price begin to fall.

Therefore, if the market spends a long time trading at a particular price, it indicates that the bulls and the bears have been battling fiercely at that price before either side won.

Consider an extreme bear market. The market is flushed with all kinds of gloomy news. No one wants to buy and everyone wants to sell. Of course, under these circumstances, the market is likely to keep falling deeply. Moreover, the market should not spend too much time trading at a particular price while it is falling since the overwhelming selling force easily dissipates the scarce buying force. Suppose under these market conditions, we see that price starts to spend a lot of time trading at every price range before managing to sink lower. This is an early sign that bargain hunting has come into the market. The market may be bottomed out soon.

The Modal Count is a useful indicator, which measures how much time the market spends trading at the Modal Point. The concept of the Modal Count has been covered in October 2 article. Readers may retrieve the article from our website.

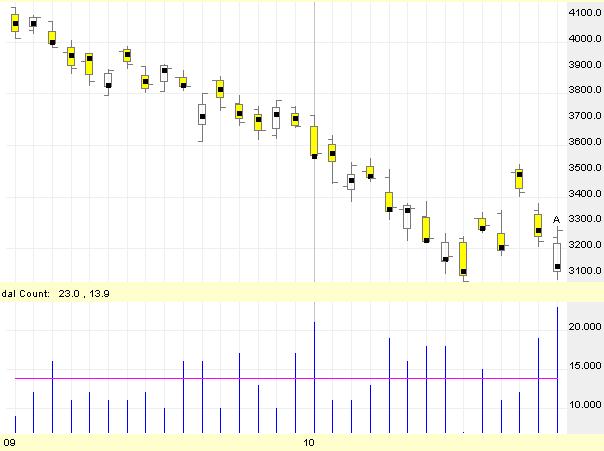
Figure 1 shows the Prosticks chart of the Nasdaq Composite Index with the Modal Count plotted below. The Modal Count indicator resembles the volume plot. Each bar indicates how many 5-minutes intervals price has traded at the Modal Point. The horizontal line is the 150-day average.

Take a note at bar A. Notice that during this day, the market opens and then tumbles as many as 148 points a frightening 4.5% drop in one day. Dramatically, in the afternoon, a burst of buying orders suddenly flushed into the market, sending the index into a rally that gave it 42 points gain for the day.

Notice that at that day, the Modal Point resides near the low of the bar, indicating that when price initially sank to day low, a huge amount of volume was traded there before the rally sparked. Take a note at the Modal Count also. The number is astonishingly high that day, signifying that when the bulls entered the market, they had been battling very fiercely with the bears for a long time before they won.

Imagine putting yourself back to that day. You saw the market tumbled drastically in the morning session. However, in midst of this gloomy atmosphere, when price sank to the intraday low of 3081, it failed to fall further. Instead, it consolidated around the day low. You saw that the consolidation lasted for an unusually long time. You should then know that hot money had come into the market and actively engaged in bargain hunting in this oversold market condition. This technique is useful for intraday trading.


sp
agreementspprivacysppatent
sp
sp
sp
sp

Copyright© 2026 ProSticks.com Limited. All rights reserved. ProSticks.com Limited, Hong Kong Exchanges and Clearing, HSI Services Limited, endeavor to ensure the accuracy and reliability of the information provided but do not guarantee its accuracy or reliability and accept no liability (whether in tort of contract or otherwise) for any loss or damage arising from any inaccuracies or omission. Currently, all Hong Kong stock and index quotes are at least 15 minutes delayed. Currency and commodity quotes are all 10 minutes delayed. All others are updated irregularly.