|
Prosticks Articles
信報
--- 八月二十一日
成交配合上破阻力升勢現
從美元兌日圓的聚焦點線圖看,頂部共有六個聚焦點落在109.45這個價位,形成聚焦點平台L1(圖一)。這聚焦點平台是一個很強的阻力,每次美元升至此位,沽壓即湧現推低價位,因此可以預期109.45在將來亦發揮阻力作用。然而,美元一旦升破此位,上升趨勢將會出現。需要留意的是,筆者所講的升破阻力位,並非指當日的某一價位,而要聚焦點也在此阻力位之上才算。
從美元兌瑞士法郎的乾坤燭圖看,自在6月份跌至1.62後開始反彈,但卻受阻於聚焦點平台L2(圖二)。L2是連接兩個價位在1.7265的聚焦點而成,其中之一是A燭的聚焦點。A燭的聚焦點有何特別?A是價位從1.75至1.62跌浪的起步點,代表強者在此開始沽出,尤其是在聚焦點價位。其後,價位再次上升,但到達L2即受阻,這個事實進一步確認L2的阻力作用。
須留意B燭是一支大陽燭,價位在當日大幅反彈。雖然價位在C燭受制於L2阻力而進行調整,但在B的聚焦點價位,應可找到初步支持。
(有關乾坤燭之連載可於乾坤燭網站
www.prosticks.com 內觀看)
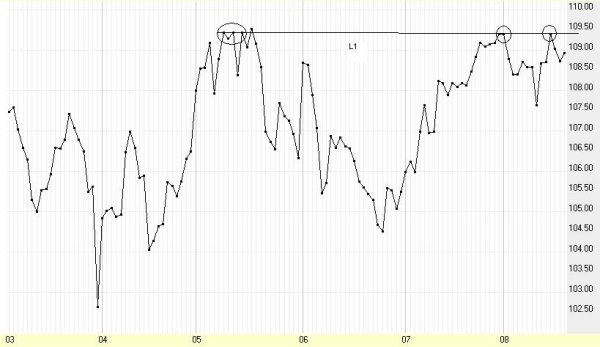
圖一 美元兌日圓聚焦點線圖
(2000年3月7日
- 8月18日)
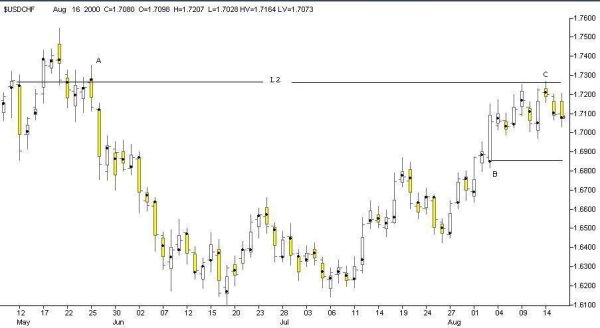
圖二 美元兌瑞郎乾坤燭圖
(2000年5月1日
- 8月18日)
|