|
Prosticks Articles
信報 --- 八月七日
撈底摸頂同樣危險
澳元是香港散戶一隻相當熱門的投資貨幣。但最近數月澳元總是在較低水位浮沉,沒有多大起色。究竟澳元後市走勢如何?
從澳元兌美元的乾坤燭圖看,在B處,價位連續三天沒有下破近期低位─A的聚焦點,表示有投資者開始趁低吸納,在A處有積聚的購買力,B提供另一個低吸機會。
其實,在B處有雙重支持,除了A的聚焦點外,還有保歷加通道底部。在B的三個交易天內,價位並沒有下破此支持,反映澳元在這個價位築底。
在投資市場上,試圖摸頂或撈底是很危險的,市場總是跟隨趨勢走。有句名言:「趨勢是你的朋友」,儘管B可能是底部,但除非看見上升的徵兆,否則不應在此時試圖撈底。
如何確定何時買入?趨勢線可以提供線索。趨勢線是可以用來指示轉向的工具,價位下破支持線,趨勢向下;價位上破阻力線,趨勢向上。
傳統的趨勢線用高低位畫出,在乾坤燭圖中,便用高低位的聚焦點來畫。聚焦點趨勢線較傳統的高低位趨勢線更為可靠,因為聚焦點代表真正的市場力量所在,即是投資者(不論買家還是沽家)在考慮當天的經濟或政治因素後認定的合理價格,而傳統的高低位可能只是當天的一宗買賣。
在附圖中,用C和D的聚焦點可畫出一條阻力線,假使價位上破此阻力線,可以確認上升趨勢,B是底部,可以買入;反之,假使B處的購買力薄弱及短暫,市場缺乏足夠的動力升破阻力線,不應買入。
(有關乾坤燭之連載可於乾坤燭網站 www.prosticks.com 內觀看)
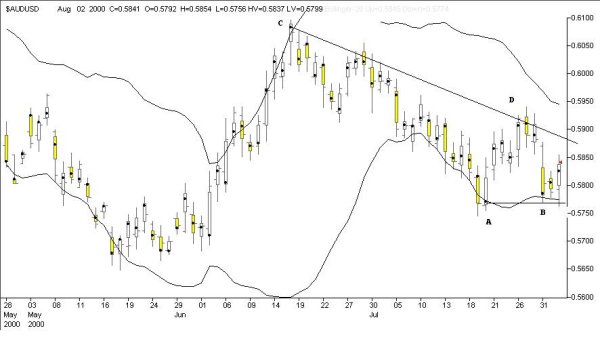
澳元兌美元走勢圖
(2000年5月28日-8月2日)
|