|
Prosticks Articles
Apple Daily --- 29 Oct, 2000
Money Management
It seems that there are two types of extremists. Some
never believe in charts and think that chartists are just
a bunch of superstitious followers. They believe that
investments should be based solely on economic and
political factors. Some Over-believe in charts and think
that they are omnipotent. These zealots believe that by
looking at patterns formed during the past few days, one
is able to forecast movements in the next year.
We do not agree with either view. Charts record the
direction of money flow and what the big guys are doing.
These big guys have many economists working for them
analyzing daily business and political trends. They have
the most information and do the most homework. If such is
the case, instead of relying on a few newspapers and
attempting to analyze the complicated global environment
ourselves, why not read the charts, discern what these
big-guys are doing and follow their footsteps? We are not
here propagating that one should never look at news or
company profile when making the investment decision.
Rather, after doing the homework, one should acquire
further insights by looking at charts and see whether the
big guys are thinking the same way as one does.
On the other hand, one should not over-believe in
charts. Of course, when a bullish pattern occurred, one
should buy. However, remember that the bullish pattern
only signifies you that some hot money is flowing into the
market. It does not tell you this hot money will be
chasing the market forever. Hence, after buying on the
bullish pattern, one should not get lazy and just go
fishing. Rather, one should monitor the market
continuously and should never wishfully think that the
pattern will never be wrong.
There are no patterns that are never wrong. The
economics and politics are always changing. Major events,
which impact the economy, significantly always come
unexpected and catch everyone in surprise. Even the
big-guys do their homework incorrectly at times. Thus, it
is impossible to think that just a few bars or
candlesticks can predict a long-term trend.
Hence, assuming that one buys on a bullish pattern and
the market does rally the next few days. One should not
lapse into complacency and think that he is the God of
Stocks? Rather, he should humbly watch out for possible
reversal signals. For example, if after jumping the few
days, the market stalls and reverses its course, one has
to be careful. Some fundamentals may have changed and the
bullish pattern may no longer be valid.
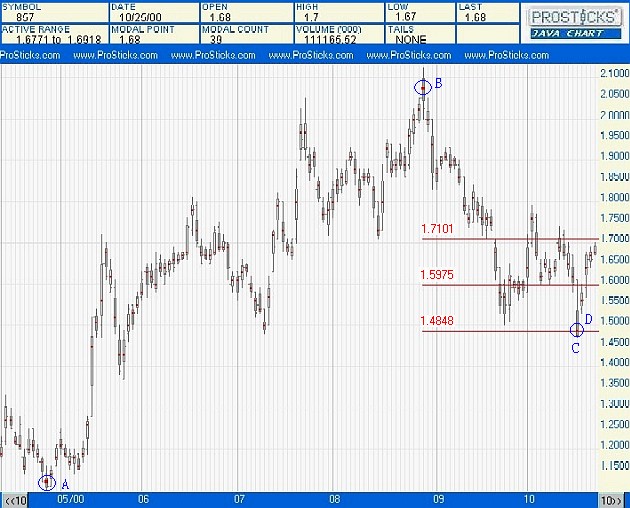
Figure 1 shows the Prosticks chart of PetroChina (857).
As can be seen, bar C is a long falling bar, with
Modal Point, Active Range, and closing price residing in
the lower part of the bar, signifying bearishness.
However, coincidentally, the Modal Point of C lies
exactly 61.8% of the Modal Point of A and B.
As discussed before, this 61.8% marks a boundary line
between a bull and a bear trend. If price rebounds from
this 61.8%, the prior up trend of A and B may
continue. The following day at D, unexpectedly,
price opens just above C's Active Range, indicating
flow of hot money into the market at this 61.8% level. As
can be seen, if one longed the stock at the D's opening,
one would be able to get a hefty nice profits in the
following few days. However, as said before, a pattern
only gives you clues on money flow for a short period of
time. After buying at D, one should not leave it
behind and hope it will rise 10 times a year later.
Rather, one should monitor the market closely. If things
for some reasons turn sour and the market turns around,
one should liquidate the position should price fall back
to the entry point.

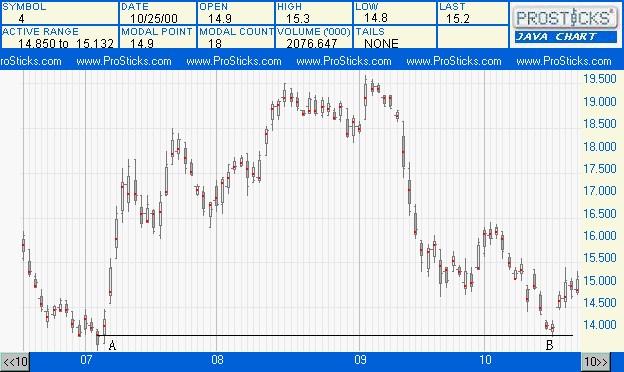
Figure 2 shows the Prosticks chart of Wharf Holdings
(0004). Notice that the low point of B is
coincident with the Modal Point of A, indicating
that buying forces at A resurfaced at B in
the current deeply oversold condition. If one bought at
the closing price of B, the investor also enjoyed a
hefty profits the following few days. Same as before, the
investor should not indulge into self-satisfaction. With
these profits in hand, one should use them as cushions to
ride on a long-term trend, if it manifests. However, if
the market turns around, one should exit at break even
level to avoid capital loss.

| 

