|
Prosticks Articles
蘋果日報 --- 十月十五日
聚焦點測市神奇
上周我們談到黃金比率可以神奇地預測市場的轉向點,在持續升勢(或跌勢)之後,出現的回吐(或反彈),通常終止於之前升幅(或跌幅)的 0.382、0.5或
0.618。但究竟是0.382、0.5還是0.618呢?
這 3個神奇數字通常是這樣應用的:假定經過持續上升之後,市場開始調整,我們首先期望它回吐到之前升幅的38.2%位置能找到支持;假如回吐不能在此位停止,會再測試50%位置;假如繼續下跌,將以61.8%位置為最後防線。
按傳統理論,假設跌破之前升幅的 61.8%,代表升勢已完結,市場進入熊市。相同地,假如下跌趨勢中的反彈能升破之前跌幅的61.8%,則代表跌勢已被扭轉,此反彈可被視為新升浪。
究竟該用到多久以前的資料取決於投資者的取向,如果是短線炒家,該用近期的資料,找出附近所有高低位的黃金比率位置;如果是長線投資者,就該用相距較遠的高低位來計算黃金比率,以決定現在是上升趨勢還是下跌趨勢,有時甚至會用到周線圖或者月線圖來計算黃金比率。但無論是短線還是長線,都決不要同市場作對,記住「趨勢是你的朋友」這句警言。
可避走勢陷阱
傳統上,黃金比率是用高低位來計算的,大家都已經知道,最高位或最低位經常會被人為操縱,不如聚焦點值得信賴,所以用聚焦點來計算黃金比率,比起用高低位更準確。
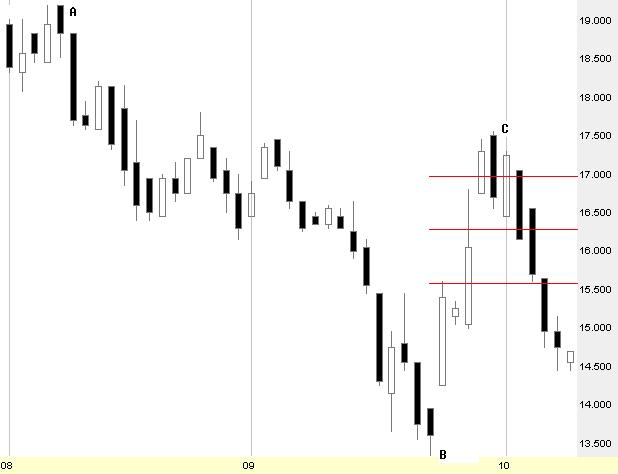
德昌電機(179)
上圖是德昌電機 (179)的陰陽燭圖,從A跌到B後,股價反彈到C,收市位已經高過0.618水平,如果你以為新升浪已展開,你將墮入走勢陷阱,因股價隨即迅速回落。
下圖是德昌電機 (179)的聚焦點線圖,可以清楚看到,反彈到C,剛好是A至B跌幅的0.618位置,並無升破,不會引你上當。
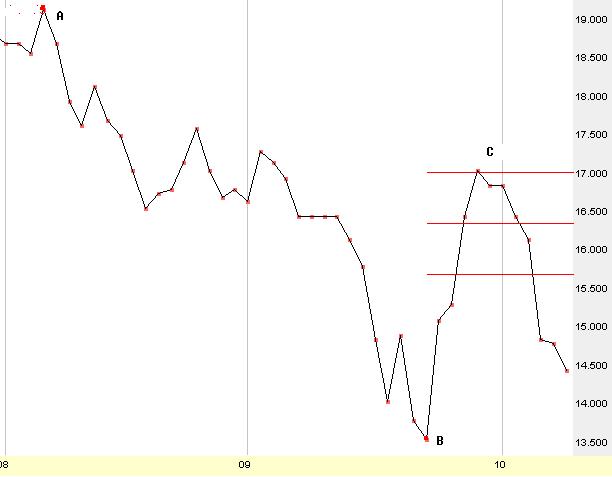
德昌電機(179)
|