|
Prosticks Articles
蘋果日報 --- 九月十日
配合聚焦量測市更準
上星期介紹了以成交時間法計算乾坤燭的參數,在成交時間法中,聚焦點是 市場花費時間最多的價位,它不一定是成交量最大的價位,而是成交最頻繁的價位。由於成交時間法不存在成交量法的某些缺陷,它的聚焦點更值得信賴。
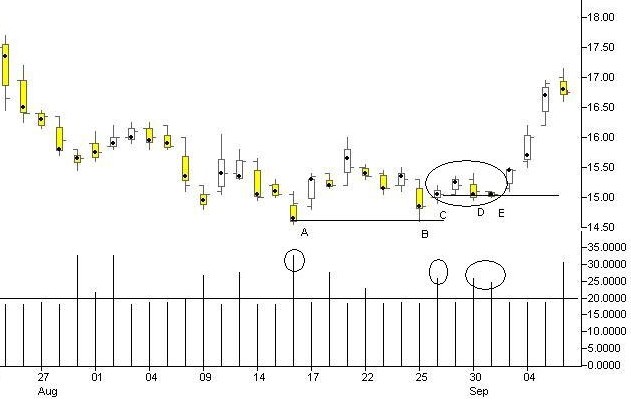
乾坤燭圖中,有個指標稱為聚焦量,它是市場花在聚焦點的時間總和。上圖為數碼通乾坤燭圖 (315),下面部分是對應的聚焦量指標。如圖所示,聚焦量類似傳統的成交量圖,每一條代表當日市場花在聚焦點的單位時間的總和。
聚焦量的計算方法是劃分交易時段為每 5分鐘一個單位,然後找出在該價位的交易有多少個5分鐘,例如:假定在100元的交易發生在11:00~11:05、11:15~11:20、15:00~15:05,則市場在100元的交易時間總和是3個單位,最大時間單位數量的價位即是聚焦點,聚焦點的交易時間總和即是聚焦量。
圖中的水平線是聚焦量的 150天平均數,假設聚焦量是在150天平均數以上,代表當日市場花在聚焦點的時間,多過一般情況。既然聚焦點是好淡雙方交易最積極的價位,市場花在聚焦點的時間逾多,即聚焦量愈高,代表好淡雙方的爭持愈激烈。
上圖A燭的聚焦量異常地高出附近的燭,而聚焦點位於燭身的底部,但收市位卻在活躍區及聚焦點的上方,表示當日買賣雙方在低位(聚焦點)長時間拉鋸,最終買方擊退了沽方,推高價位。幾天之後,價位在B處再次跌到A的聚焦點價位,購買力量又再出現,將價位推高。
圖中用圓圈圈出的位置,C、D、E都有同樣的聚焦點價位,形成聚焦點平台,而且聚焦量也都較高,不但高於附近的燭,也高過 150天平均線。
由此可知,在C、D、E 3日,好淡雙方在一個同樣的價位,曾經展開激烈的交戰,這種現象可以預見,任何一方疲憊的時候,價位就會出現突破。
留意一個細節:C、D、E的聚焦點,是在B的活躍區之內,不出所料,E之後的一日,開市價在聚焦平台之上,隨後數日連續上升。
聚焦量概念可以用來預測聚焦點,例如,假定聚焦量的 150天平均數是20,在某一天,聚焦量已經達到30,聚焦點在13元。在這種情況下,即使未收市,也可以斷定,聚焦點會停留在13元,若炒波幅的話,可以以13元為中間位,高沽低買。
(有關乾坤燭之連載可於乾坤燭網站
www.prosticks.com 內觀看)
數碼通(315)
|