|
Prosticks Articles
蘋果日報 --- 八月二十七日
市況見底有跡可尋
乾坤燭圖適合於分析所有市場,今天本欄談談如何用乾坤燭圖來分析美股。
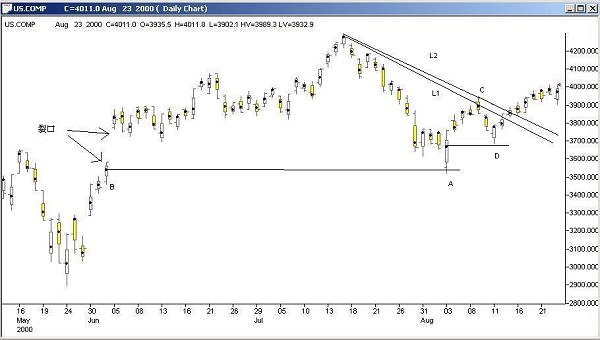
納斯達克綜合指數(日線圖)
上圖是納斯達克指數的乾坤燭圖,7月中創出4289的高位之後,進入調整期,調整終止於A的低位,巧合地與B日的聚焦點位相同價位。注意在B位有一個大裂口,按技術分析理論,在重拾升軌之前,調整通常會回補裂口。很明顯,在A位價格回補裂口之後,買盤蜂擁而至,這些買盤源自於B的聚焦點位,裂口亦是在B燭形成的。
再看清楚A燭,裂口低開,但在最高位收市,在陰陽燭理論中,這是「單日轉向」,表示見底回升,因此在A處,當我們看到(1)單日轉向訊號、(2)裂口被補回及(3)低位同B燭的聚焦點價位一致的時候,應該可以推測市場在A會見底。
從A反彈到C後,出現另一次較小的調整,這次調整終止於D,即是A的聚焦點位,即是說,源自於A的買盤,在D處再現,故B、A、D之買盤其實是息息相關的。
入市訊號更快
經過以上分析,我們應否在D處買入?記住傳統智慧「趨勢是你的朋友」,即使推測到A處及D處有購買力支持,但在上升趨勢被確認之前,不應該急於衝入市場。
趨勢線是評估市場趨勢的有效工具,當價位升破阻力線時,出現上升趨勢;當價位跌破支持線時,出現下跌趨勢,因此,當我們認為有可能在D見底時,可以畫一條阻力線,確定升破此線才可買入。
在此圖中,L2是用傳統的方法,連接兩個高位畫出,L1是連接聚焦點而畫出的阻力線,圖中以看到,聚焦點趨勢線L1比傳統趨勢線L2更快發出訊號。
下圖是杜瓊斯指數的乾坤燭圖,與上面討論的概念相類似,讀者不妨將之套入此圖作分析。
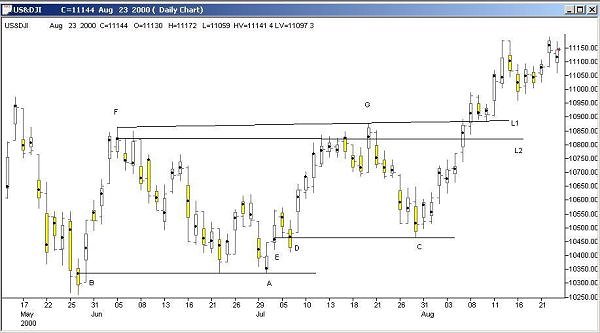
杜瓊斯工業平均指數(日線圖)
|